Key Financial Ratios Every Investor Must Know (PE, ROE, PB & More)
Key Financial Ratios Every Investor Must Know (PE, ROE, PB & More)

When you start investing in the stock market, share prices alone can be very misleading. A stock trading at ₹2,000 may look expensive, while another at ₹200 may look cheap — but the reality is often the opposite. This is where financial ratios come in.
Financial ratios help you understand whether a company is actually cheap or expensive, profitable or struggling, and financially strong or weak. In this detailed guide, we will cover the most important financial ratios that every serious investor in the Indian stock market should know.
Why Financial Ratios Matter
Imagine two companies:
- Company A is making good profits and growing steadily
- Company B is barely profitable and drowning in debt
If you only look at the share price, you may end up buying the wrong one. Ratios give you a clear, numbers-based view of the business.
Here are the most important ratios every investor must understand:
1. Price to Earnings Ratio (PE Ratio)
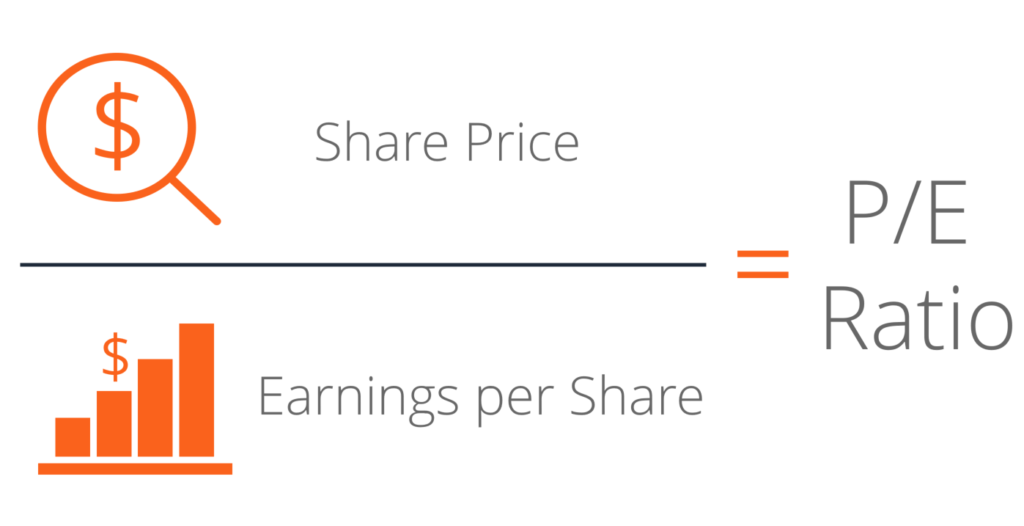
PE Ratio = Current Share Price ÷ Earnings Per Share (EPS)
What it tells you: How much investors are willing to pay for every ₹1 of the company’s earnings.
Example: If a company’s share price is ₹1,000 and its EPS is ₹50, then PE = 20.
How to interpret:
- Low PE (below industry average) → Possibly undervalued
- High PE → Market expects high growth, or the stock is expensive
- Very high PE without growth → Warning sign
Ideal Range (General):
- Fast-growing companies: 25–40
- Stable companies (banks, FMCG): 15–25
- Cyclical companies: Can be lower
Important Tip: Always compare PE with the industry average and the company’s historical PE.
2. Price to Book Ratio (PB Ratio)
:max_bytes(150000):strip_icc()/price-to-book-ratio-bf64b6abed4d4d2292f3ab58bd55ed36.png)
PB Ratio = Current Share Price ÷ Book Value Per Share
What it tells you: How much you are paying compared to the company’s net assets (what the company owns minus what it owes).
Example: If share price is ₹500 and book value per share is ₹250, then PB = 2.
How to interpret:
- PB below 1 → Stock may be undervalued (common in banks and PSU companies)
- PB between 1–3 → Reasonable for most companies
- Very high PB → Market is pricing in strong future growth or brand value
Best used for: Banks, NBFCs, and asset-heavy companies.
3. Return on Equity (ROE)
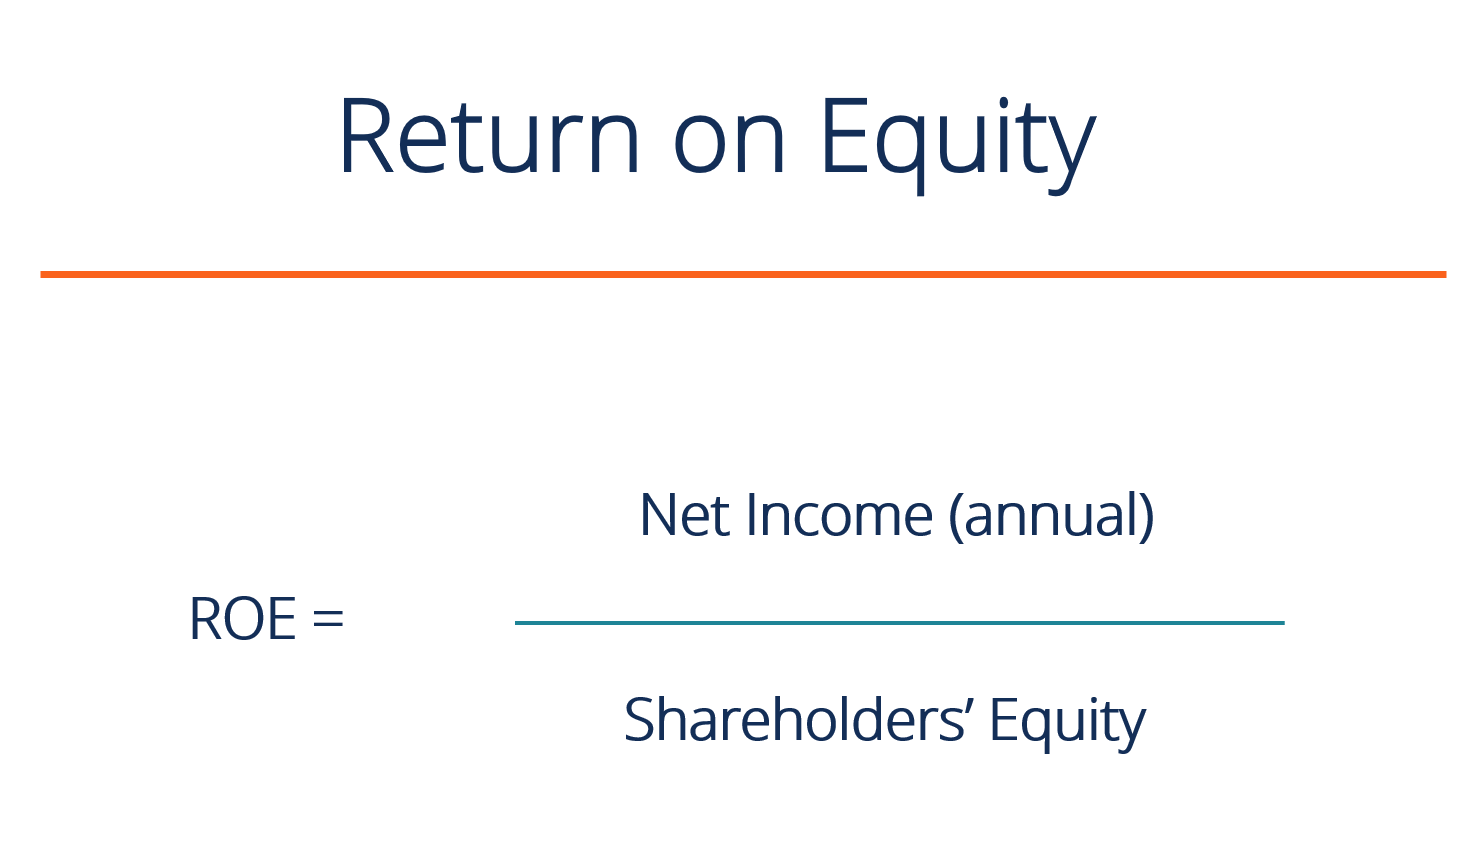
ROE = (Net Profit ÷ Shareholders’ Equity) × 100
What it tells you: How efficiently the company is using shareholders’ money to generate profit.
Example: If a company makes ₹200 crore profit and has ₹1,000 crore equity, ROE = 20%.
How to interpret:
- ROE above 15–18% is generally considered good
- Consistently high ROE (over many years) is a sign of a strong business
- Very high ROE with high debt can be risky
Why it is important: Warren Buffett loves companies with consistently high ROE.
4. Return on Capital Employed (ROCE)
Formula: ROCE = (EBIT ÷ Capital Employed) × 100
What it tells you: How well the company is generating returns from the total capital used in the business (equity + debt).
Why it is useful: ROE only looks at equity. ROCE looks at the entire capital. It is especially useful for companies that use a lot of debt.
Good ROCE: Generally above 15%.
5. Debt to Equity Ratio
Formula: Debt to Equity = Total Debt ÷ Shareholders’ Equity
What it tells you: How much debt the company is using compared to its own money.
How to interpret:
- Below 1 → Comfortable
- 1 to 2 → Manageable for many industries
- Above 2–3 → High risk (especially in rising interest rate environments)
Note: Capital-intensive industries (steel, power, telecom) naturally have higher debt levels.
6. Earnings Per Share (EPS)
Formula: EPS = Net Profit ÷ Number of Outstanding Shares
What it tells you: How much profit the company is making per share.
Why it matters: EPS growth over the years is one of the strongest indicators of a good company. Rising EPS usually leads to rising share prices in the long term.
7. Dividend Yield
Formula: Dividend Yield = (Annual Dividend Per Share ÷ Current Share Price) × 100
What it tells you: How much dividend income you are getting relative to the share price.
Example: If a stock is at ₹1,000 and gives ₹30 dividend, yield = 3%.
Good for: Investors looking for regular income (retired people, conservative investors).
8. PEG Ratio (Price/Earnings to Growth)
Formula: PEG Ratio = PE Ratio ÷ Earnings Growth Rate
What it tells you: Whether the PE is justified by the company’s growth.
How to interpret:
- PEG around 1 → Fairly valued
- PEG below 1 → Possibly undervalued
- PEG above 1.5–2 → May be expensive
This ratio is very useful for growth stocks.
How to Use These Ratios Together
Never look at just one ratio. Here’s a simple checklist:
| Ratio | What to Check | Good Sign |
|---|---|---|
| PE | Compared to industry & history | Reasonable or lower |
| PB | Especially for banks & asset companies | Not too high |
| ROE | Consistency over 5–10 years | Above 15% |
| ROCE | Compared to ROE | Healthy and stable |
| Debt/Equity | Industry context | Not excessively high |
| EPS Growth | Last 5 years trend | Rising |
| Dividend Yield | If you want income | Sustainable |
Common Mistakes Investors Make
- Looking only at PE and ignoring growth
- Comparing PE of a bank with PE of a tech company
- Ignoring debt levels
- Buying high ROE companies without checking if the ROE is sustainable
- Not checking ratios over multiple years (one good year is not enough)
Final Thoughts
Financial ratios are like a health check-up for a company. They don’t guarantee that a stock will go up, but they significantly improve your chances of avoiding poor businesses and finding quality companies at reasonable prices.
Start by practising on companies you already know — Reliance, TCS, HDFC Bank, Infosys, or Asian Paints. Look at their PE, ROE, PB, and Debt ratios over the last 5 years. Over time, reading these numbers will become second nature.
The best investors don’t just buy stocks. They buy businesses — and financial ratios help you understand the business better than almost anything else.


Comments
Post a Comment